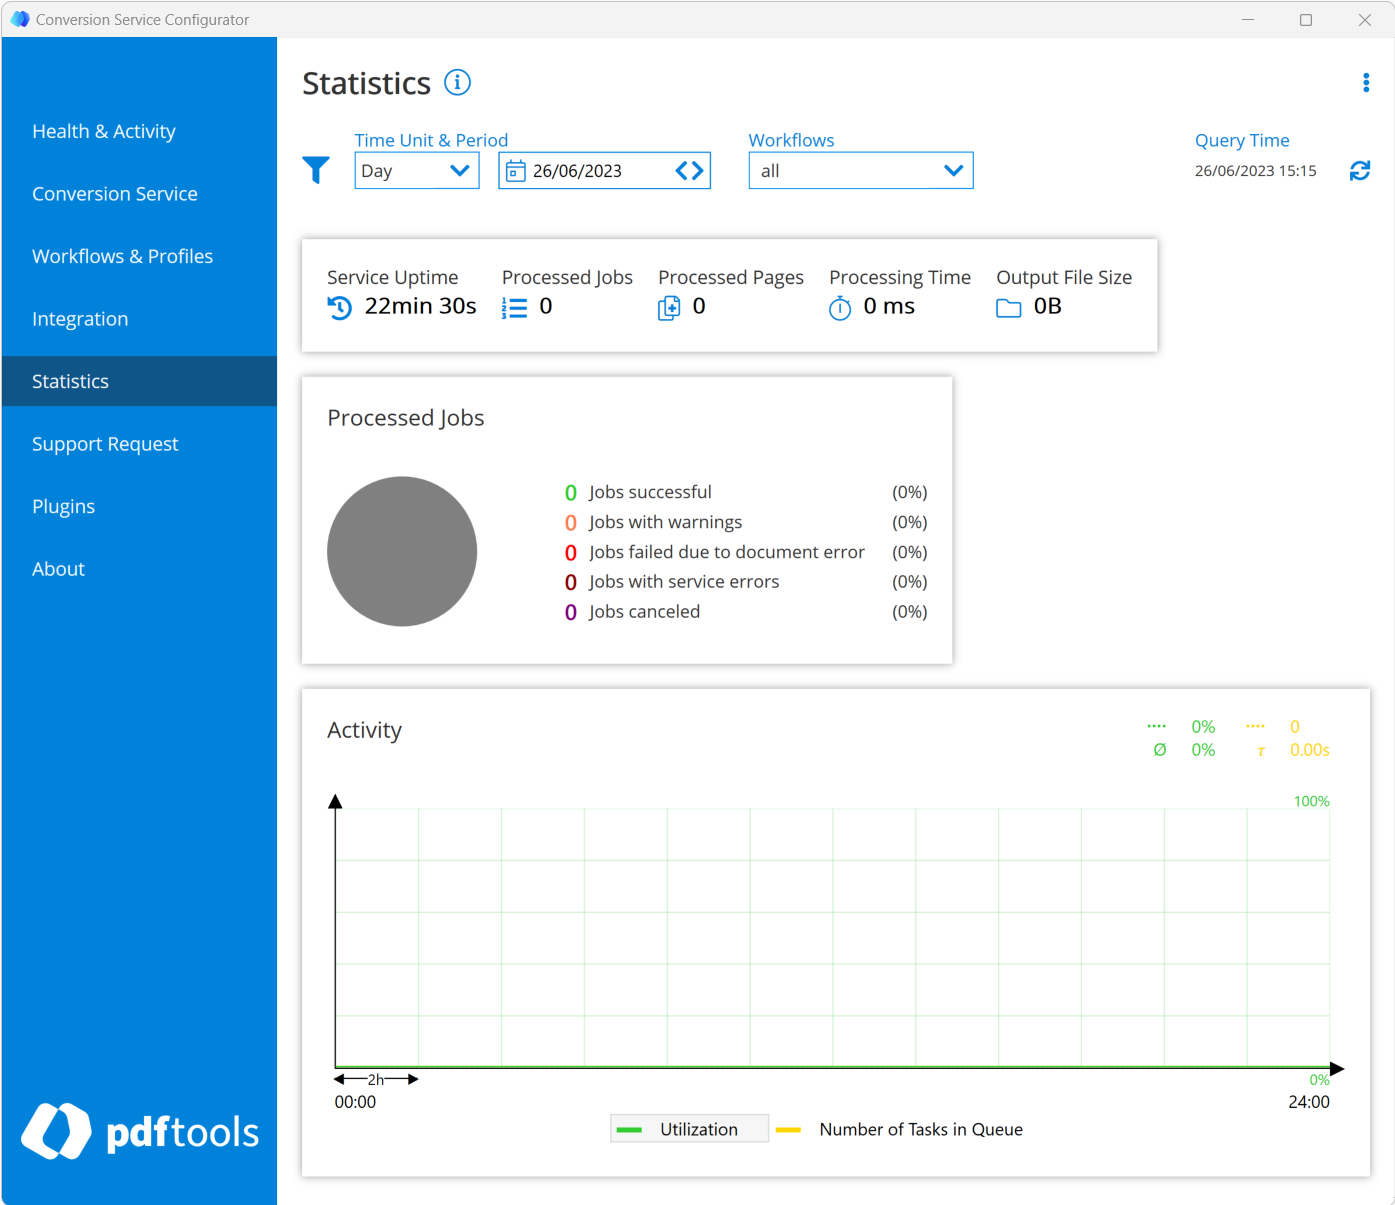
Statistics
Information about the past activity of the service is reported by the Statistics tab of the the Conversion Service Configurator GUI, which is added to the Windows start menu during installation.
With this tab, the conversion history of the service can be analyzed. The Statistics tab consists of the following parts:
- Filters: A section containing a set of filters to control the data displayed in the tab.
- Simple statistics: An overview displaying the performance of the service.
- Processed jobs: Pie chart about the results of the processed jobs.
- Activity: Time chart indicating service's load and performance for a selected group of jobs.
In addition, the data displayed in the tab can be exported for further analysis.
Filter section
In the top row of the tab, below the title, the following filters can be configured to be applied to the data displayed in the tab:
Time unit & period
Determines the period of time when the jobs were processed. On the left-hand side, the length of the period can be configured by selecting one of the following time units:
- Day
- Week
- Month
On the right-hand side, the point of time where the period occurred can be selected either by clicking on the calendar icon and choosing it from the calendar dropdown which has appeared or by clicking the arrows.
Workflows
Filter data to show usage, load ,and job results of specific workflows.
Query time
The time point when the query for the displayed data was made. The query time is only relevant if the current day is part of the selected time period. The query time can be updated with the refresh icon in this case.
Export data as CSV
Click Export Data as CSV in the top-right menu to export the data selected by the filters from the database.
When the export has finished, a ZIP archive containing the following CSV files is saved:
service.csv contains the following columns:
started: Service start time.stopped: Service stop time.maxConcurrentTasks: Concurrency supported by the license, i.e. the maximum number of tasks which can be executed in parallel. For more information, see Health & Activity.
jobs.csv contains the following columns:
id: Row number.jobId: Unique identifier name of the job.worklow: Name of the workflow the job was processed with.profile: Name of the profile the job was processed with.started: Point in time when the service started to process the job.finished: Point in time when the service completed the job.error: Name of the error if the job failed.warnings: List of the names of the warnings that occurred when processing the job.outputFilesCount: Total number of output files resulting from the conversion.overallOutputSize: Total number of bytes summed over all output files resulting from the conversion.overallPages: Total count of pages summed over all output files resulting from the conversion.
tasks.csv contains the following columns:
id: Row number.job: Row number of the job the task is associated with tasks.queued: Point in time when the task began waiting in the queue for being processed.started: Point in time when the task moved out of the queue and the service started to process it.stopped: Point in time when the service was finished with processing the task.component: Names the type of processing step applied through this task.
Simple statistics
Displays some characteristic numbers about the jobs considered by the current filter configuration and the service:
- Service uptime: The total amount of time that the service has been running.
- Processed jobs: The total number of jobs that have been processed.
- Processed pages: The total sum of pages of documents converted to PDF.
- Processing time: The total sum of job processing time. Note that this number can be higher than Service Uptime since multiple tasks can be processed in parallel.
- Output file size: The total sum of output file size of the processed documents.
Processed jobs
The pie chart summarizes the jobs considered by the current filter configuration in the following categories:
- Jobs successful: Jobs converted successfully.
- Jobs with warnings: Jobs converted with warnings.
- Jobs failed: Jobs that failed with errors related to the input document like for example Corrupt, UnsupportedFormat or Generic.
- Jobs with errors: Jobs that failed due to a Timeout, Configuration or Internal error.
- Jobs canceled: Jobs that where canceled by the user.
Activity
The time chart indicates the service's load and performance. The filters apply to this diagram as well. It displays the following two curves:
- Utilization (green): Plots the percentage of processing capability used. The total possible processing capability of the service depends on your license and your system.
- Number of tasks in queue (yellow): Shows the number of tasks are waiting in the queue for being processed.
On top of the diagram, on the very right, there are four numbers, each next to a symbol. These values are in the color of the curve they are associated with. The top green value is the maximum. The bottom green value is the average of the utilization. The top yellow value is the maximum number of tasks in queue for the selected period. The bottom yellow value is the average time a task spends waiting in the queue before being processed.
When you change the selected item in the legend at the bottom of the chart, the curve it represents is brought to the foreground together with its associated grid for easier reading. Note that for the Y-axis, the range of values is labeled at the right-hand side.