Health & Activity
The state and recent activity of the service is monitored by the Health and activity tab of the the Conversion Service Configurator GUI, which is added to the Windows start menu during installation.
The purpose is to provide an overview of the service's performance. It consists of the following parts:
- The number of jobs that the service is currently processing
- Time passed since when the service was started
- Validity of the license
- Pie chart about the results of the jobs processed on the current day
- Time chart tracking the service's load and performance
Jobs, tasks, and parallel execution
A job is the unit that is sent to and processed by the Conversion Service. A job consists of input documents, a workflow name, a profile name, and an output path. Depending on the job content, a set of processing steps is required to complete its execution (such as destructuring, conversion, merging, etc). A task is the execution unit of such a processing step. Tasks are generally executed in parallel and tasks are held in a queue in case the service is charged to capacity.
The parallel processing capacity of the service depends on the license and the underlying hardware system. The license and hardware limit the number of tasks that can be processed in parallel by the service. This number is referred to as the maximum number of concurrent tasks (maxConcurrentTasks).
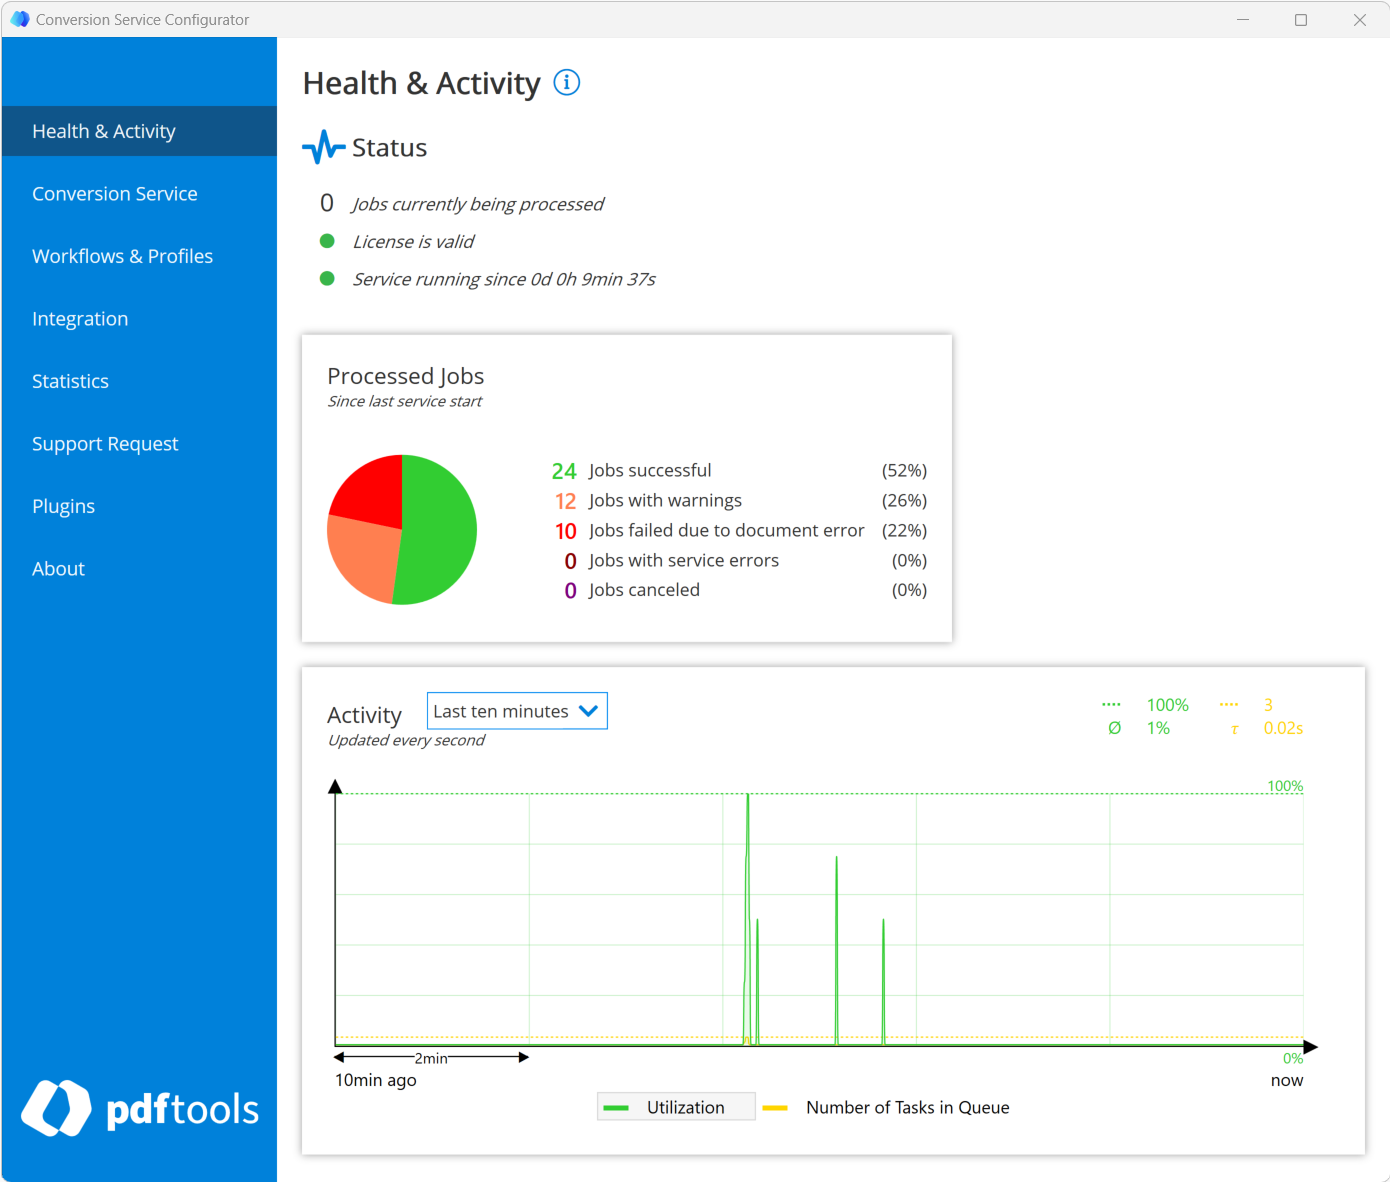
Status
Summarizes the status of the Conversion Service by displaying the count of currently processed jobs, status of the license, and service uptime.
Processed jobs
The pie chart summarizes and monitors jobs processed during the current day in the following categories:
- Jobs successful: Jobs converted successfully.
- Jobs with warnings: Jobs converted with warnings.
- Jobs failed: Jobs that failed with errors related to the input document. For example, Corrupt, UnsupportedFormat or Generic.
- Jobs with errors: Jobs that failed due to a Timeout, Configuration or Internal error.
- Jobs canceled: Jobs that where canceled by the user.
Activity
The time chart gives an indication on the service's load and performance. It displays the following two curves, which are limited by the parallel processing capacity of the service:
- Utilization (green): Plots the percentage of processing capability used. The total possible processing capability of the service depends on your license and your system.
- Number of tasks in queue (yellow): Shows the number of tasks are waiting in the queue for being processed.
On top of the diagram, on the very right, there are four numbers, each next to a symbol. These values are in the color of the curve they are associated with. The top green value is the maximum. The bottom green value is the average of the utilization. The top yellow value is the maximum number of tasks in queue for the selected time span. The bottom yellow value is the average time a task spends waiting in the queue before being processed.
Next to the Activity heading, the following time spans can be configured for the chart:
- Last ten minutes
- Last hour
- Last two hours
- Last four hours
When you change the selected item in the legend at the bottom of the chart, the curve it represents is brought to the foreground together with its associated grid for easier reading. Note that for the Y-axis, the range of values is labeled at the right-hand side.